
A few days ago, we showed you a quick and easy way to collect data from a REST API, in this case Wikipedia. The structure was very simple and a good starting point. Today, we will move on to something more complex. This example will introduce you to the authorization using application links and demonstrate the power of a converter. The underlying structure is still simple and coding will be kept to a minimum.
JIRA: Issue Overview per Status Category
Let’s talk about JIRA. It is possible to customize the status a JIRA issue passes through, but they are always assigned one out of three status categories. JIRA has no easy solution to report how many issues are currently in a state associated with the category “To Do”, “In Progress” or “Done”, so if you have a complex workflow it might be tricky to get the big picture. Many of our customers struggle with this. So now we will build an overview like that.
Prerequisite
The easiest way to connect Confluence to a JIRA with the same user base is by using the Application Link functionality. The connection has to be set up in Confluence at “General Configuration” -> “Administration” -> “Application Links”. Make sure the status shown there says “Connected” indicating that everything is working fine.
Datasource
typeREST Application LinkDatasource
Application LinkYour Company Jira
Test URL/rest/api/2/search
The PocketQuery datasource is very easy when an Application link exists. The authentication is handled using the link, so we barely need any information besides the link. Again you can check whether the link is set up correctly by using a test URL.
Query
Query URL/rest/api/2/search?jql=project%3D:project
Query JSON path$.issues
Query settingsEnable "Add results to Confluence search"
The query URL has nothing to do with status categories yet. This will be sorted out in the converter. For now, we’ll simply collect all JIRA issues from a specific project. Within the result we want to work with the array of issues that’s located at $.issues, so we set our JSON Path accordingly.
Converter
Now this is where the magic happens, so we need a few more lines of code. But the structure itself is simple and we can stick to a basic Javascript code.
We loop through all issues (ll. 6-15), look up the status category of each one and then increase its counter (ll. 8-11). Finally, we transform the data into a simple two dimensional array, that we can hand on to the default template (ll. 18-24). Lines 26-28 also include some sorting based on the name of the categories, as the order by id isn’t what we naturally expected. Note: At this point, make sure to set the converter to the query.
Table result
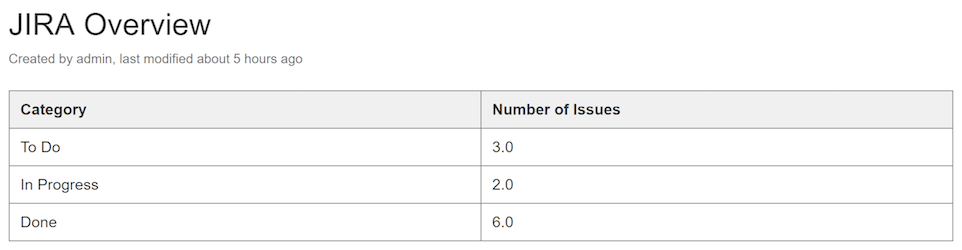
Using the default template, our result looks like this when adding the macro to a page. Each status category is listed along with the number of issues in states that belong to this category, regardless of its specific state.
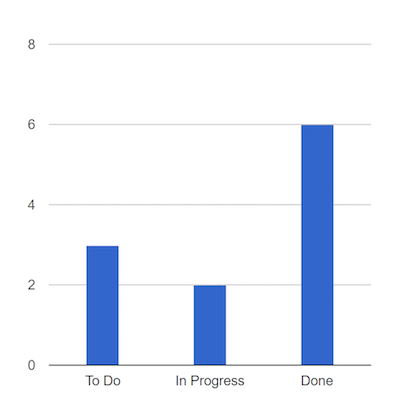
Chart template
Thanks to the Google charts library that is embedded into PocketQuery, we can also choose to display our result as a column chart. To do so, we need to build a custom template with the following code:
After applying this new template to our query, the overview turns from a table into a chart. If this isn’t perfect for getting a brief overview of the ticket situation, what else is?
Wrapping It Up
We hope these two examples gave you a brief idea of what is possible using REST APIs and the new converter feature. You can find more REST examples for other popular online applications in our documentation. Did you build something really cool? We will be more than happy to add it to the collection (anonymously, of course) and credit you. Please, get in touch with us! Have fun exploring the possibilities of PocketQuery!
Where to go?
And there is even more:
- Download the latest version of PocketQuery (See what´s new) and leave a review at the Atlassian Marketplace.
- Look at more REST examples.
- Read the PocketQuery documentation and learn more about the new features.
- Have a look at our examples and tutorials.
- Raise a ticket with your question or feature request at our Service Desk.
- Contact us at support@livelyapps.com.

.png)


.png)
.png)