Hey everyone 👋
Usage Statistics helps you understand how Confluence is really being used across your team. In this post, we’ll talk about where the data comes from, what it shows, and how it helps you make smarter, faster, better decisions.
Why Usage Statistic Matters?
Let’s be real - Confluence can get busy. And it gets busy. Pages, whiteboards, smart links, databases, tasks, comments, attachments… and that’s just THIS week.
Usage Statistics has always given a high-level view of what’s active. Sometimes however, you need to zoom in on the details that actually matter to you.
For example:
🔍 Which team created the most content last month?
✅ What tasks were completed last week?
🧠 Who’s been adding whiteboards with the “marketing” label?
Until now, the answer involved a lot of scrolling in the Confluence search.
The Fix: Smarter Filters for Real Insights
With our latest Lively update, Usage Statistics now includes a powerful, easy-to-use filter bar.
You can now filter your Confluence usage data by:
- Content type (pages, databases, whiteboards, embeds, etc.)
- Users (see what specific people created or interacted with)
- Labels (track by project, tag, or topic)
- Tasks (Monitor created tasks and whether or not these tasks were completed)
- Comments (Analyze engagement)
- Attachments (Ensure file activity is right where you want it)
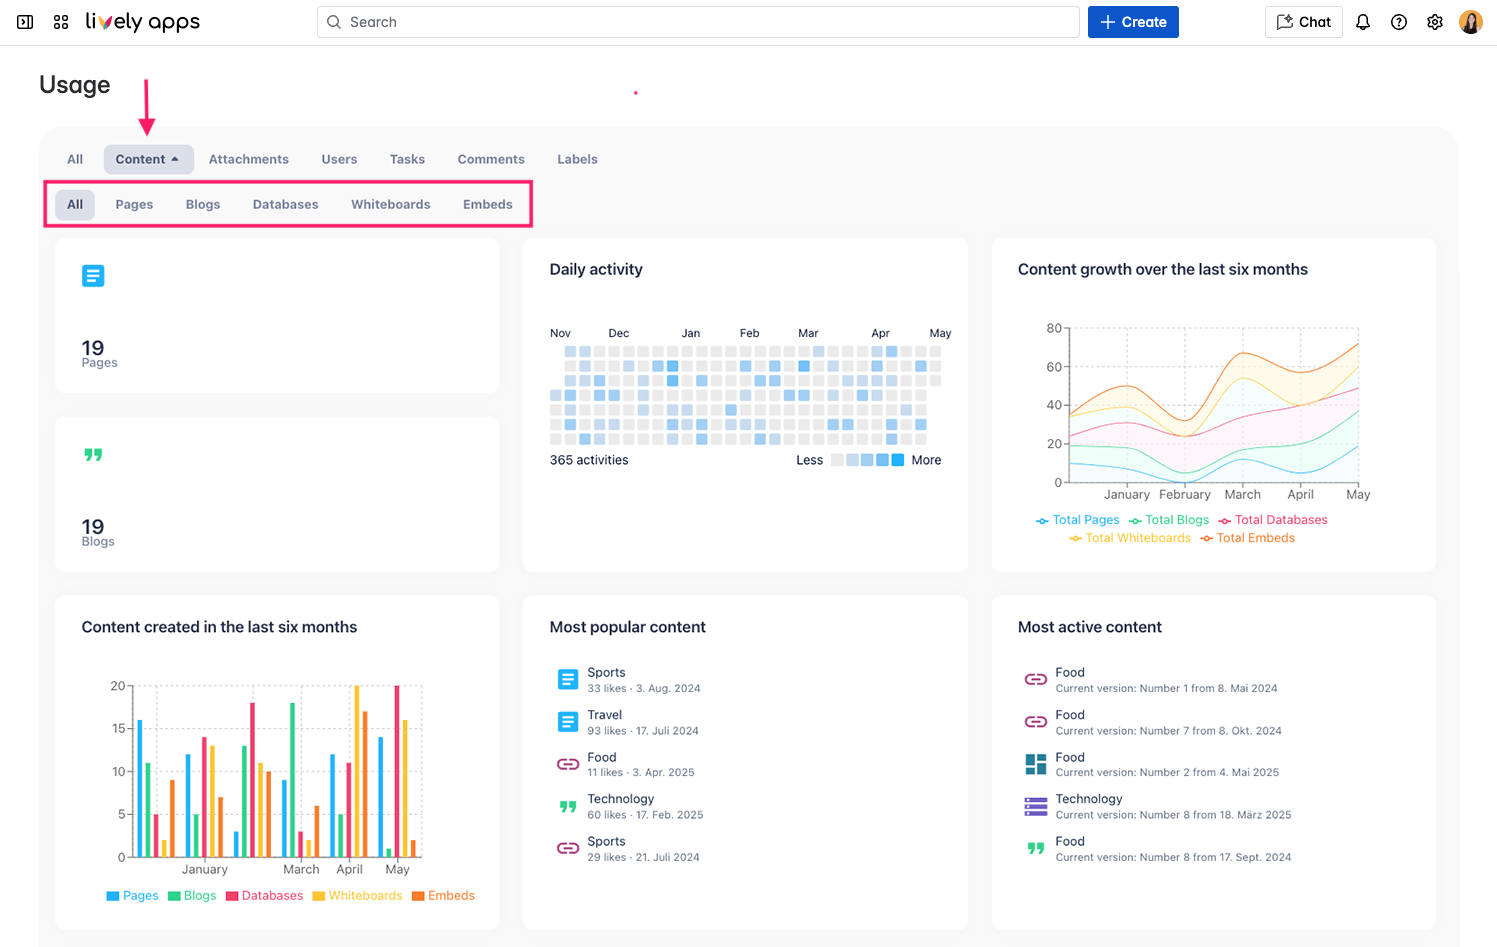
It’s super intuitive — pick your filters, and your dashboard updates in real time.
No more tab-switching.
Why teams love it
✅ Zoom in fast – Focus on exactly what you need, instantly
🧠 Spot patterns and trends – See what’s working, what’s active, and who’s involved
📊 Make smarter decisions – Use real usage data to clean up, reorganize, or double down
We share this update because we tried it out ourselves. It helped us in the following ways:
- Campaign-related whiteboards using the #marketing label
- Notice active users in the product team
- Pages with lots of comments (that clearly need follow-up!)
It helps us stay focused and aligned.
Try It Out
Already using Usage Statistics? The filter bar is live in your dashboard. 🎉
Still new to Usage Statistics?
👉 Check it out on the Atlassian Marketplace — and start making your Confluence data actually work for you.
See you in the stats,
Alice from Lively Apps

.png)