Usage Statistics Logo
Usage Statistics
4.7/5
Confluence spaces grow fast. Outdated pages pile up. Usage Statistics shows what matters.
Analyze your spaces with 18 key metrics — content growth, user activity, dusty pages, and more — as embeddable dashboards right inside Confluence.
We empower 3.3+ million users worldwide
Features

What Usage Statistics does

18 key metrics

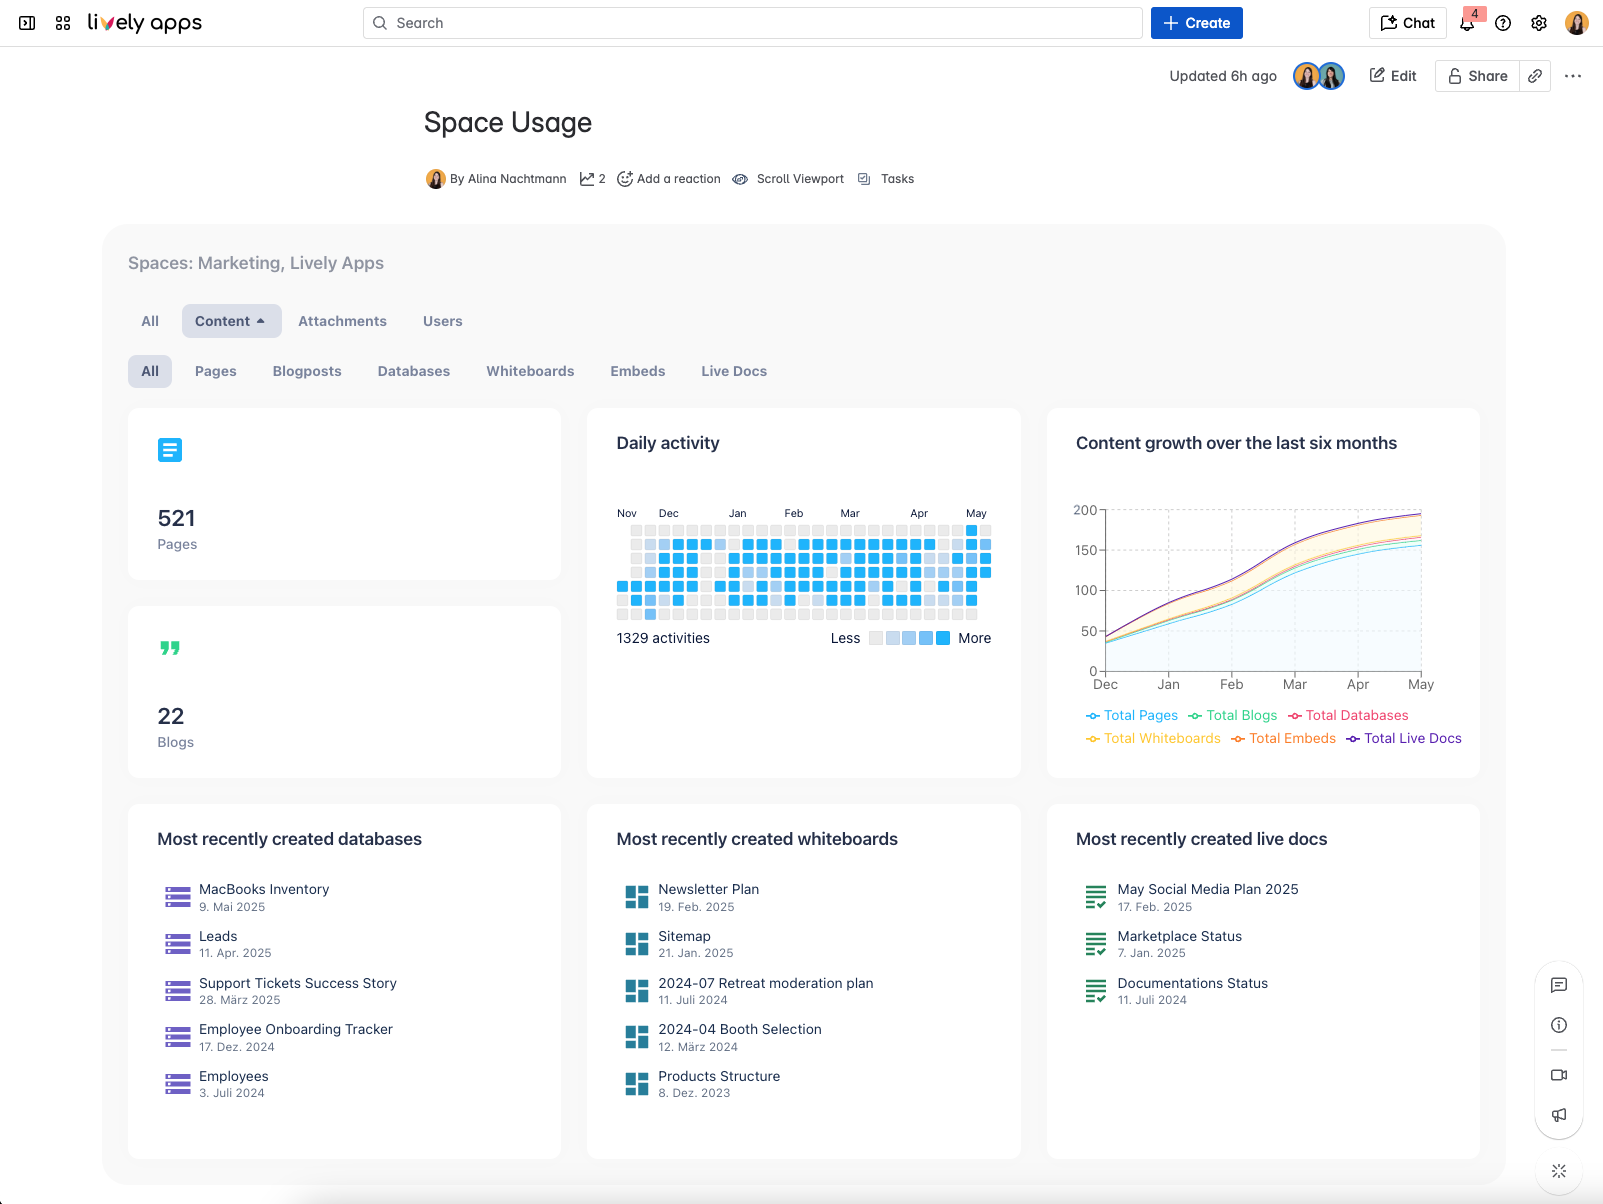
Track content counts, growth trends, top contributors, dusty pages, attachments, tasks, live docs, whiteboards, Loom videos, and more — all from one app.

Embedded dashboards

Every metric is a Confluence macro. Drop widgets onto any page to build content health boards, executive overviews, or project activity feeds.

Content health insights

Find neglected pages, spot large attachments, and see which content people actually use — so cleanup is targeted, not guesswork.

Flexible filters

Zoom in by content type, user, label, or task. See onboarding article performance, top contributors in a space, or storage-heavy attachments.

Activity at a glance

Visualize daily activity, six-month growth, and popular content with clear charts — insights stay where your team already works.

Forge-native & secure

Built on Atlassian Forge and Cloud Fortified. Usage data stays in your Confluence instance — no external analytics platform required.
Who it's for

Built for these teams

Knowledge managers
Govern content quality with dashboards that show dusty pages, growth trends, and contributor activity across spaces.
Space admins
Keep spaces tidy with visibility into what is growing, what is stale, and where storage is consumed — without manual page audits.
Content owners
See which pages and blogs get attention, which need a refresh, and where duplicates or outdated docs may be hiding.
Documentation teams
Prioritize documentation updates with metrics on popular content, recent activity, and pages that have gone quiet.
IT & governance
Support cleanup initiatives, migration planning, and AI readiness with trusted usage data that never leaves Confluence Cloud.
Leadership
Give executives six-month growth overviews and contributor summaries on Confluence pages — no separate BI tool required.
Usage Statistics by Lively Apps turns Confluence activity into actionable insight — embed dashboards where work happens, filter to what matters, and keep content healthy for today and for AI-powered search tomorrow.
How it works

The gap between growing content and knowing what to keep

Confluence spaces accumulate pages, attachments, and contributors faster than teams can audit them. Without visibility, outdated content stays live, storage grows, and search — including AI tools like Rovo — surfaces noise alongside trusted knowledge.

Usage Statistics closes that gap. Pick the metrics you need, embed them on any page, and act on clear charts instead of guessing which content still matters.
Usage Statistics dashboard showing Confluence content metrics, growth charts, and popular content

From raw activity to clear decisions

Choose your metrics

Open Usage Statistics in a space and browse 18 metrics — content growth, dusty pages, top contributors, attachments, live docs, and more.

Build dashboards in Confluence

Insert macros on admin pages, project hubs, or executive summaries. Combine widgets into a content health board tailored to your team.

Act on what you see

Archive neglected pages, refresh popular docs, and reduce storage bloat — with data that stays inside Confluence and updates as your space evolves.

Built with Forge

Atlassian Silver Marketplace Partner Badge

Built with Forge

Usage Statistics runs on Atlassian's Forge platform and is Cloud Fortified. Your usage data never leaves your Confluence instance.
FAQ

Frequently asked questions

What problem does Usage Statistics solve?

Confluence spaces grow quickly, but it is hard to see which content is active, outdated, or taking up storage. Usage Statistics surfaces 18 key metrics — from growth trends and top contributors to dusty pages — so teams can maintain healthy, relevant spaces.

What metrics are available?

Usage Statistics includes 18 metrics covering content counts, attachment breakdowns, growth trends, most popular content, top contributors, dusty pages, task activity, live docs, whiteboards, Loom videos, and more — each available as a Confluence macro.

Can I build dashboards inside Confluence?

Yes. Every metric is available as a macro you can drop onto any Confluence page. Build content health dashboards, executive overviews, or project activity boards without leaving the platform.

Can I filter metrics by content type or user?

Yes. Flexible filters let you focus on pages, blogs, whiteboards, live docs, labels, tasks, or specific users — so you see the activity that matters for your space or team.

Does Usage Statistics help prepare Confluence for AI?

Yes. Clean, up-to-date content improves search and AI tools like Rovo. Usage Statistics helps you find neglected pages and large attachments so you can archive noise and keep trusted knowledge accessible.

Who typically uses Usage Statistics?

Knowledge managers, space admins, content owners, documentation teams, and IT governance teams who need visibility into how Confluence is used and which content needs attention.

Is Usage Statistics built on Atlassian Forge?

Yes. Usage Statistics runs on Atlassian Forge. Your usage data stays within your Confluence Cloud instance. The app is Cloud Fortified and meets Atlassian’s standards for reliability, support, and enterprise security.

Is Usage Statistics available on Confluence Cloud?

Yes. Usage Statistics for Confluence Cloud is available on the Atlassian Marketplace with a free tier to get started.
Try Usage Statistics now

Ready to see what's happening in your spaces?

Install Usage Statistics, add your first metrics, and start building dashboards in minutes.