Hi there,
Confluence is where your teams share knowledge, document projects, and collaborate in real time. It grows with every idea, every decision, every attachment. But with growth comes a familiar challenge: keeping content healthy.
Over time, any Confluence space grows quickly: new pages are added, files are uploaded, and information keeps flowing. Without a little care, it can become harder to find the right content when you need it. Old pages stick around, attachments multiply, and important updates get overlooked. The result? Teams spend extra time searching, sometimes duplicate work, and occasionally rely on information that’s no longer up to date.
That’s why content health matters just as much as content creation. And it’s exactly what Usage Statistics for Confluence helps you manage.
Why Content Health Is Critical
A healthy Confluence space is:
- Relevant → content people actually use
- Up to date → refreshed regularly, not forgotten
- Accessible → structured and easy to navigate
The problem: without visibility, it’s impossible to know which content fits that description and which doesn’t. That’s where Usage Statistics comes in.
Turn Activity Into Clarity
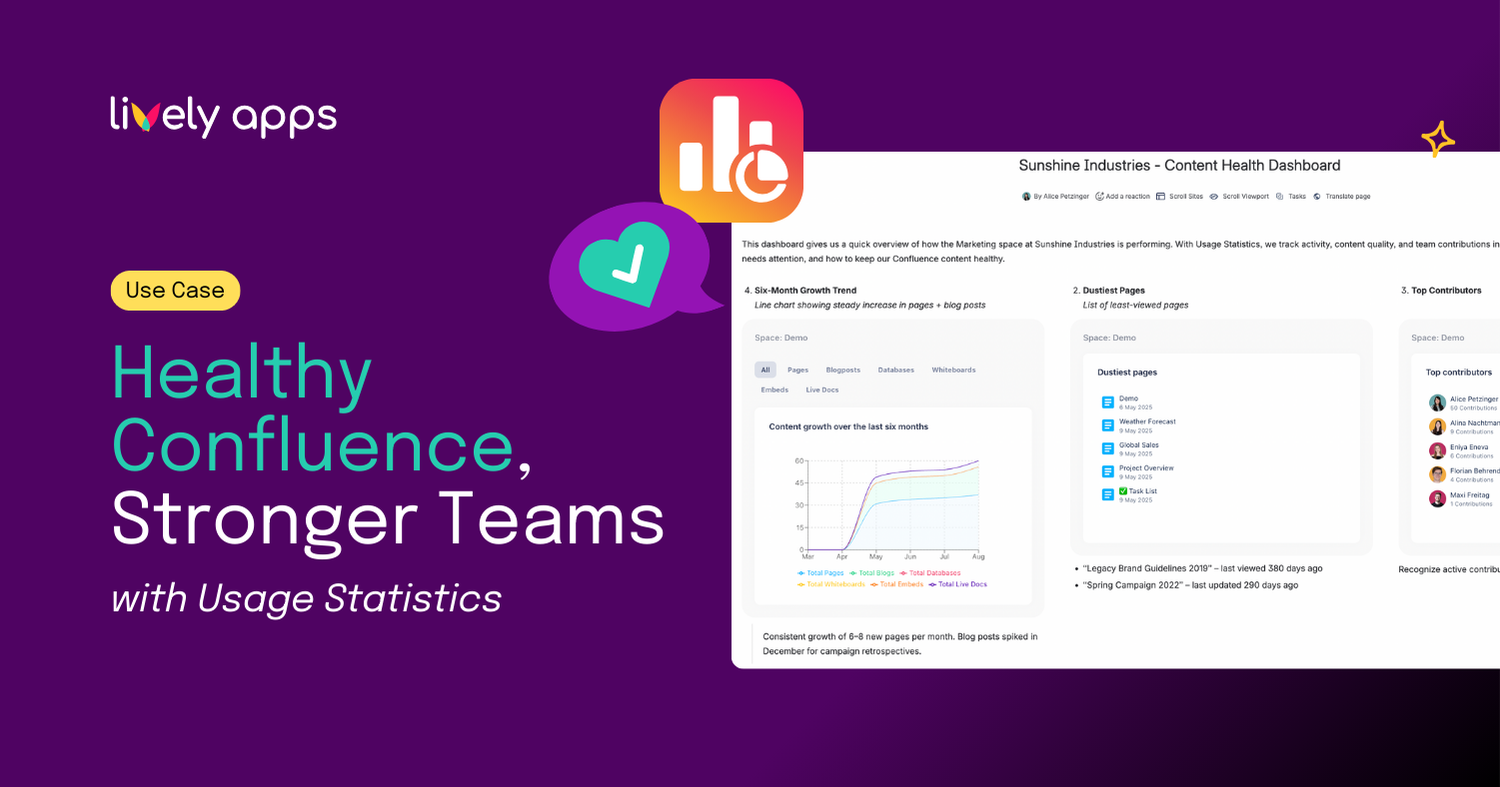
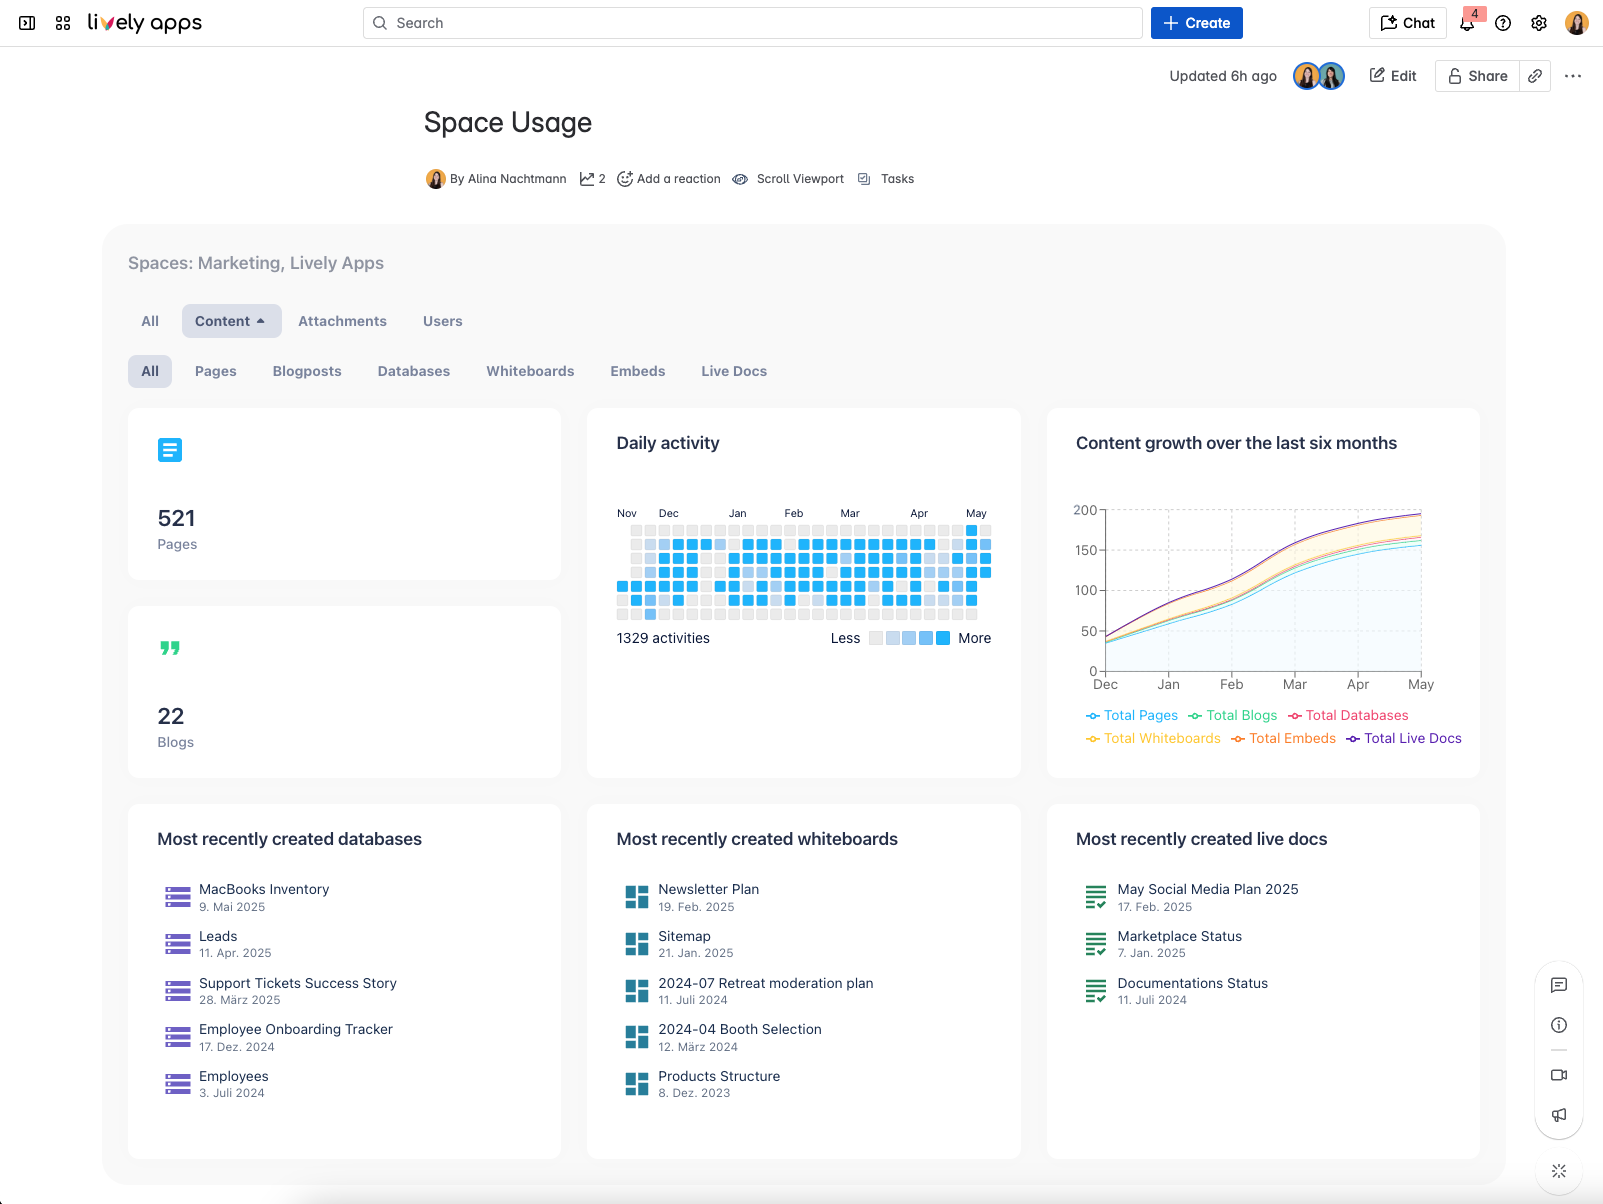
Usage Statistics gives you 18 key metrics that make the state of your Confluence content visible: from content counts and attachment breakdowns, to top contributors, task activity, and even the “dustiest” pages that haven’t been touched in months.
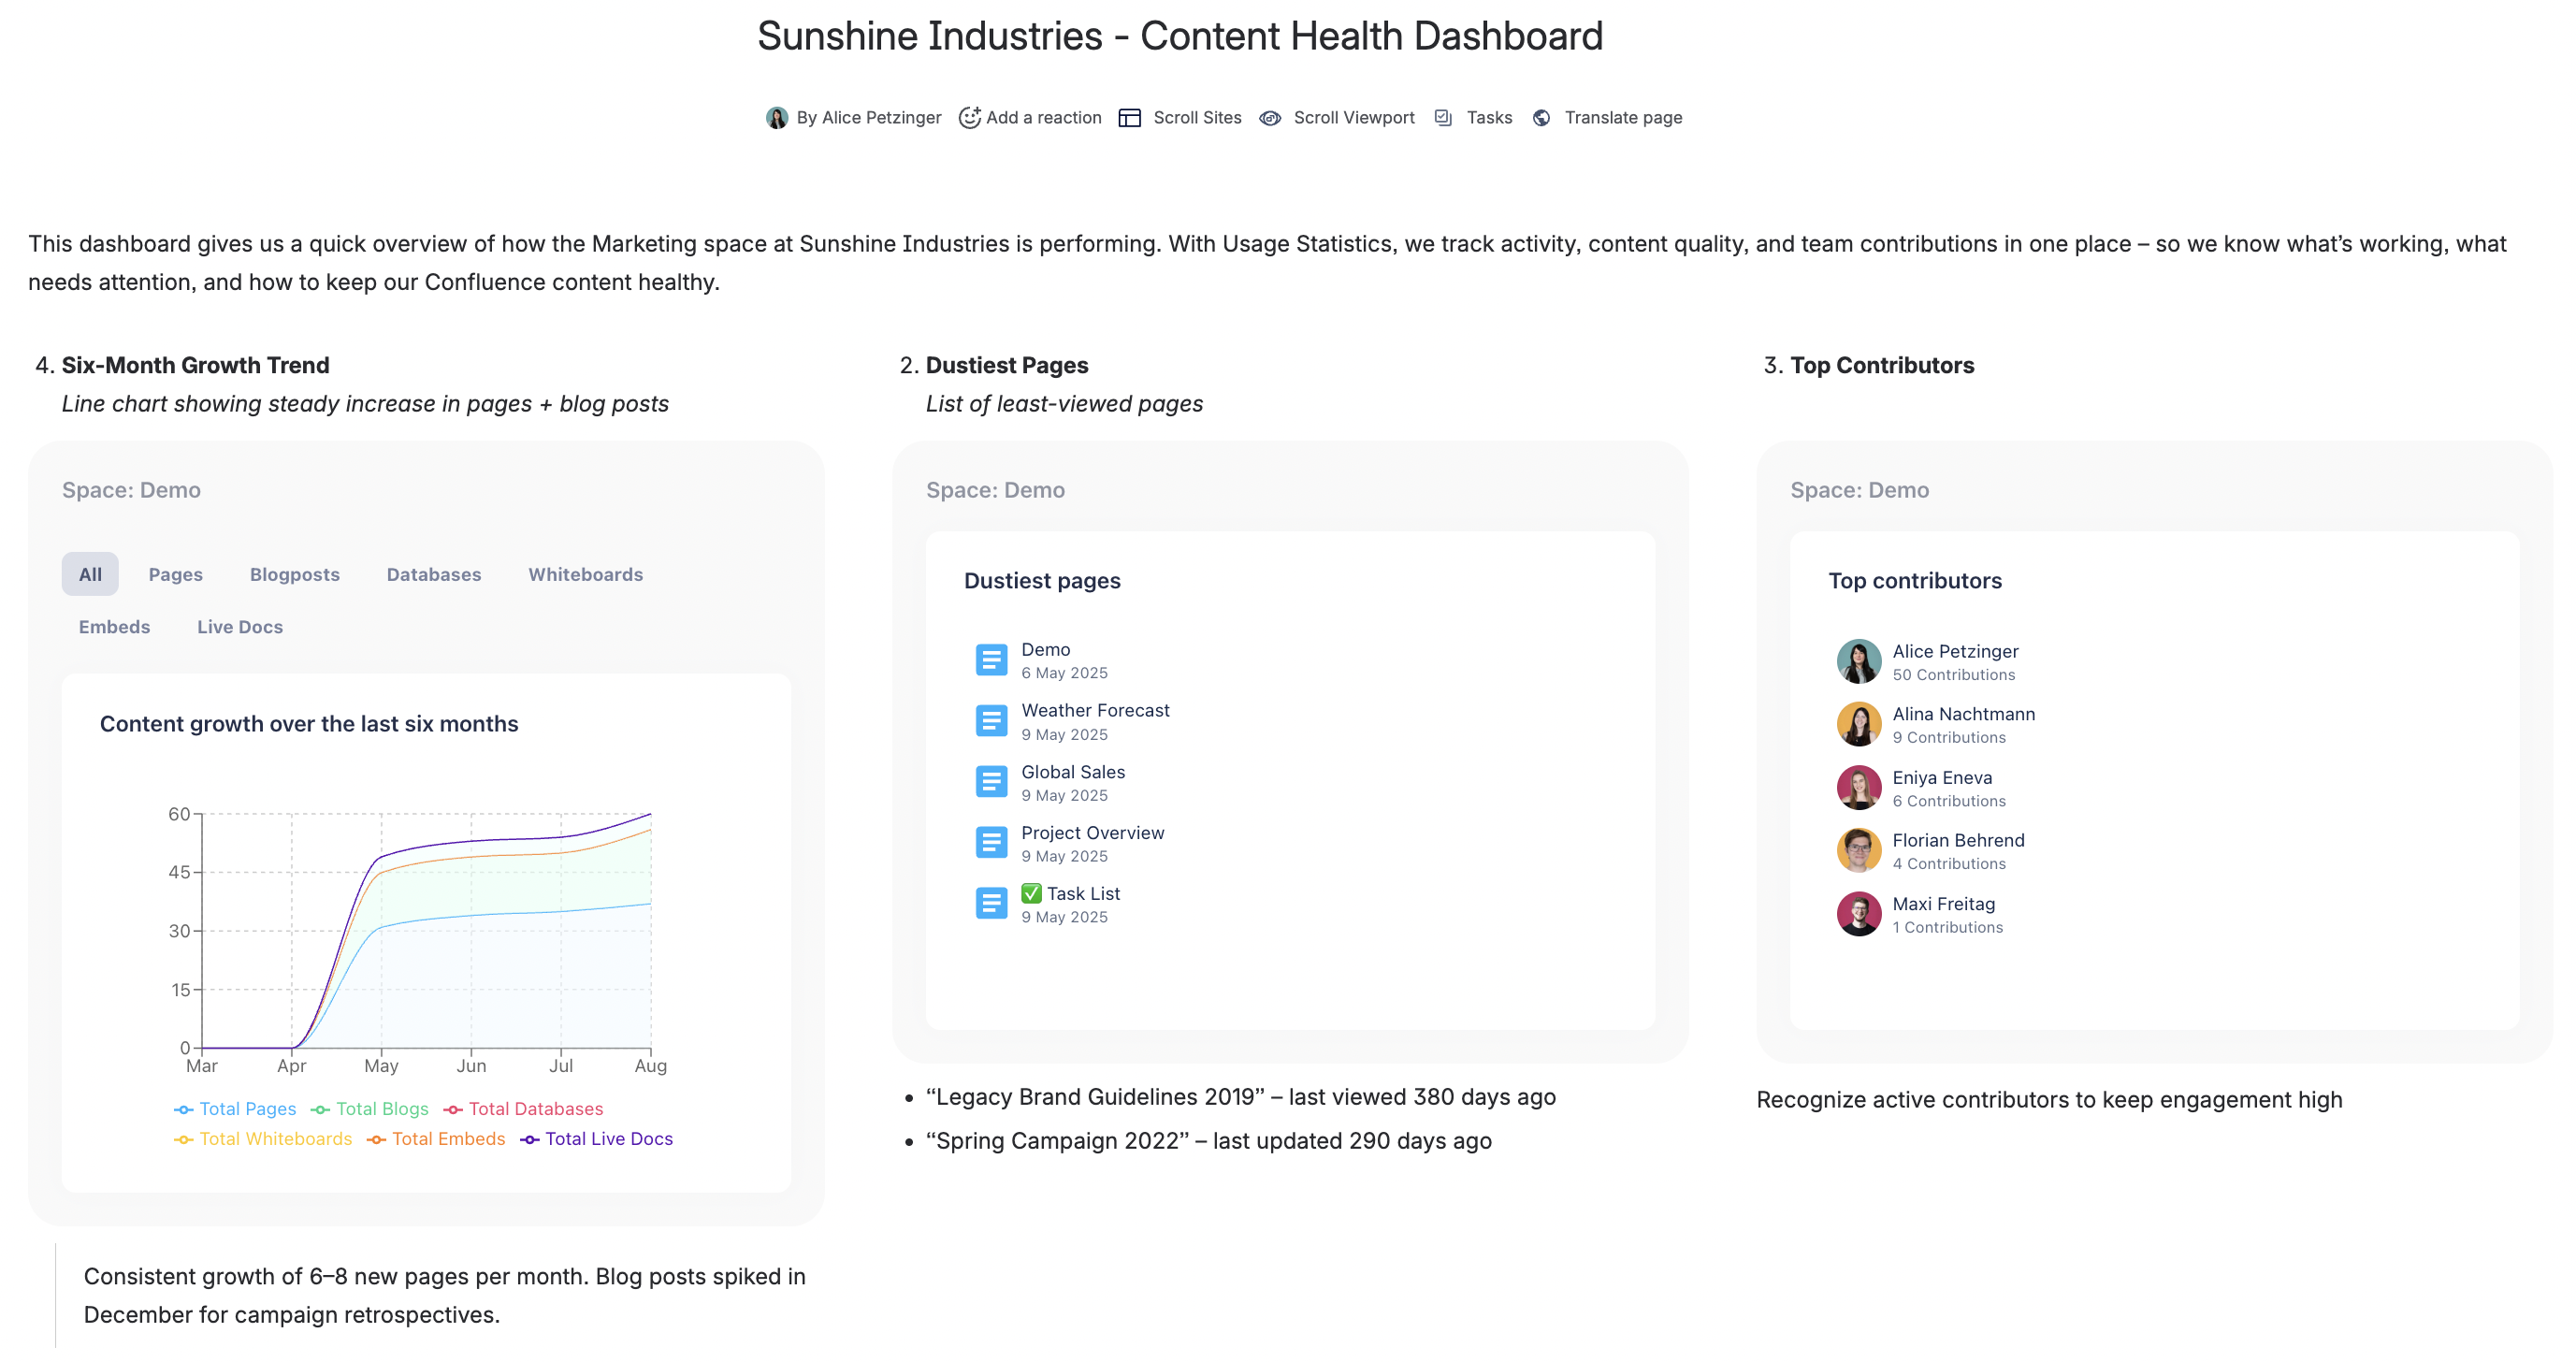
Every metric is available as a Confluence macro, so you can drop it onto any page and create your own dashboards.
- Add a Daily Activity feed to a project space to track activity.
- Build a content health dashboard for admins showing neglected pages, attachments, and label usage.
- Give executives an overview of six-month growth trends and top contributors.
Because everything lives inside Confluence, insights aren’t hidden in a separate tool, but they’re embedded right where work happens.
Focus on What Matters
Flexible filters let you zoom in on the metrics that matter most: by content type (pages, blogs, whiteboards), by users, by labels or tasks.
Want to see how your onboarding articles are performing? Check "Most Popular Content". Curious which user contributes most to a space? Add "Top Contributors". Looking for large files eating up storage? Add the metric "Big Attachments".
It’s quick, visual, and actionable.
Cleaning Up Content Pays Off Twice
As Atlassian expands with AI-powered tools like Rovo, the quality of your search results and answers depends directly on the quality of your content. If your spaces are full of outdated or irrelevant pages, that noise will surface in your AI results too.
By using Usage Statistics to identify “dusty” pages, archive what’s no longer relevant, and keep content structured, you’re not just helping current users, you’re also preparing your Confluence for the future. Clean, trusted content means better search results, more accurate AI answers, and higher confidence across the organization.
Secure by Design
Usage Statistics is built on Atlassian Forge, so all data stays within your Confluence Cloud. As a Cloud Fortified app, it meets Atlassian’s highest standards for reliability, support, and enterprise security. No extra setup, no compromises, just insights you can trust.
A Healthier, Smarter Confluence
Great knowledge bases aren’t just written and they’re maintained. Usage Statistics helps you keep Confluence clear, relevant, and ready for the future. With embedded dashboards and actionable insights, your team can see what matters, clean up what doesn’t, and trust the content they rely on.


.png)